For the last several weeks, I’ve been having a T1 circuit issue at one of my remote sites. The carrier has been working the problem, but the issue is intermittent and difficult to narrow down. This site is way out in the boonies, and I think some of the cable span is old and some moisture has leaked into the cable. So, what can you do to see the health of a T1 circuit? Take a look at the controller stats using the command…
show controller t1 0/0/0 (use the appropriate card slot numbering for your interface)
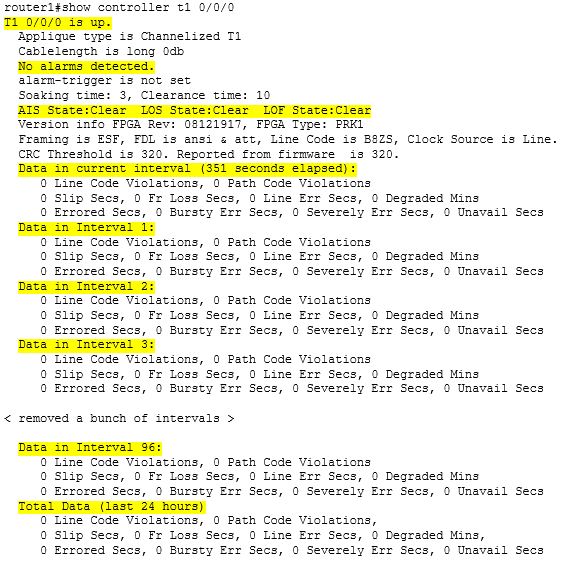
Each Cisco router keeps a log of the errors on a T1 circuit for the past 24 hours, in 15 minute blocks…so 96 “intervals” as we say. Take a look at this snippet of a clean running T1 circuit…
The first data interval is for the current 15 minute block, and shows the elapsed time…in this case 351 seconds. After that, each interval is a full 15 minutes, and this sample shows a very clean running T1 circuit. Notice the last block of data shows the summary of all errors for the preceding 24 hours (96 intervals). I sure wish all my T1’s ran this clean.
Now, here is a snippet from my problem T1 taken earlier today…
A bit messy wouldn’t you say? The first 3 intervals show a circuit up and running, but VERY poorly…few, if any, applications would work properly over this type of circuit (and they weren’t, which my end customer could vouch for). Take a look at interval 17…there are 900 unavailable seconds, which is how many seconds there are in 15 minutes. So for this interval, the circuit was completely down. And notice the Total Data for all intervals…this circuit is indeed in very poor health.
What does this information tell you? Basically, with this kind of high error rate, the problem is almost always with the carrier (issues with the cable span, NIU, or Central Office equipment). In all my years of troubleshooting T1 circuits, I’ve only had a few times where the issue was on my side (it was cabling issues with my extended DMARC usually). And remember, you can copy this information and send it to the carrier to help prove your case.
Hope this helps!


Great information! Just curious, does the server keep more than just the past 24 hours? In other words, can you go back and look at its log for January 1st?
No, the router only keeps controller stats for the last 24 hours. However, you can look through your logs and search for interface and protocol “UPDOWN” events, which will give you a good view of circuit stability for days, even weeks (especially if you collect your logs on a log server, which I will be talking about in a future post). Here is an example of this from my problem T1 circuit yesterday…
It’s sad that you have to prove to the Telco that they have a problem. I’m curious, about what percentage have you had to prove the Telco was the problem over it being your problem?
Good question Shane. Let me rephrase this…I guess about half the time they do see the problem right away as being on their end. And about 5% of the time it ends up being an issue on my side (router or extended DMARC). But a good 40-45% of the time we have to continually push the carrier to stay on top of the problem. As soon as they get a clean test, they want to close the ticket…yet we are still seeing issues/errors. I will admit we have an unusual situation in that we have about 12 remote sites that are way out in the sticks, and you just know they are hanging off the last group of 12 copper pairs, about as far from the CO as you can get. We have gotten very good at talking the carrier lingo and knowing what to ask for and what to expect.